With great power comes great responsibility
The myWindsock.com website analyses weather conditions before or after your ride so you can plan or assess your ride accordingly.
>>> Check out all our best mountain bike routes
It uses weather forecast databases mapped on to pre-plotted or pre-ridden GPS routes to display how the wind was and how it is likely to be in the future.
Outing Strava ‘cheats’
And yes, you can use it to check out whether that person at the top of a Strava segment leaderboard had a significant tailwind.
myWindsock: “Curious as to the weather conditions faced by those at the top of a Strava Segment leaderboard? Our historic weather data gives you the power to See the Wind for the fastest on a Strava segment”
Being a Strava ‘cheat’
You can also use it to try to ‘cheat the system’ and bump up your Strava leaderboard placing on any segments prone to wind.
myWindsock: “Our colourful WindLines show you exactly how the wind will affect your route. Knowing when and how the wind will effect your ride can help you to prepare and execute your race in the most efficient way.”
Your cycling weather forecast awaits. Where will the headwind be at its strongest?Connect Strava or upload a route at myWindsock.com
Posted by myWindsock.com on Friday, February 3, 2017
myWindsock’s aims are to “quantify weather conditions for cyclists and to assist the planning and analysis of competitive and non-competitive bike rides” … “View colour coded maps, yaw angles, crosswind speeds and more. A crucial tool for athletes serious about getting the edge in their next event.”
As seeing as we all know that in the age of Strava every ride is now a race and every segment is now an enduro stage, your “next event” is probably just your next regular bike ride.
Does it work?
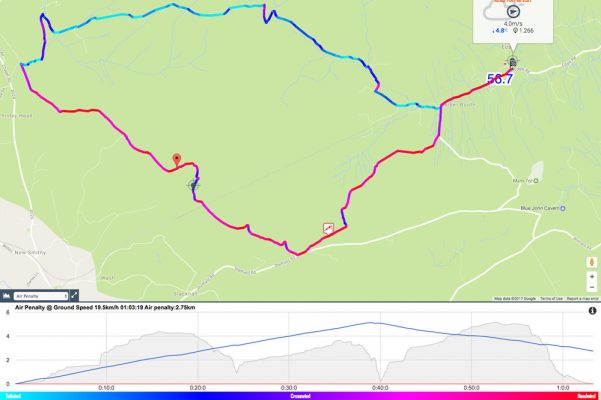
We uploaded a gpx file from a route from our recent Where to ride in the Peak District when it’s wet feature and this is what myWindosck spat out…

myWindsock’s analysis of the Vertebrate Graphics Winter Route
myWindsock’s colour coding: blues for tailwinds, purples for crosswinds and reds for headwinds.
So in this instance it looks like a headwind-fest for the outward leg – complete with particularly tough start – and a tailwind-assisted second half. Nice! We’ll have that.


